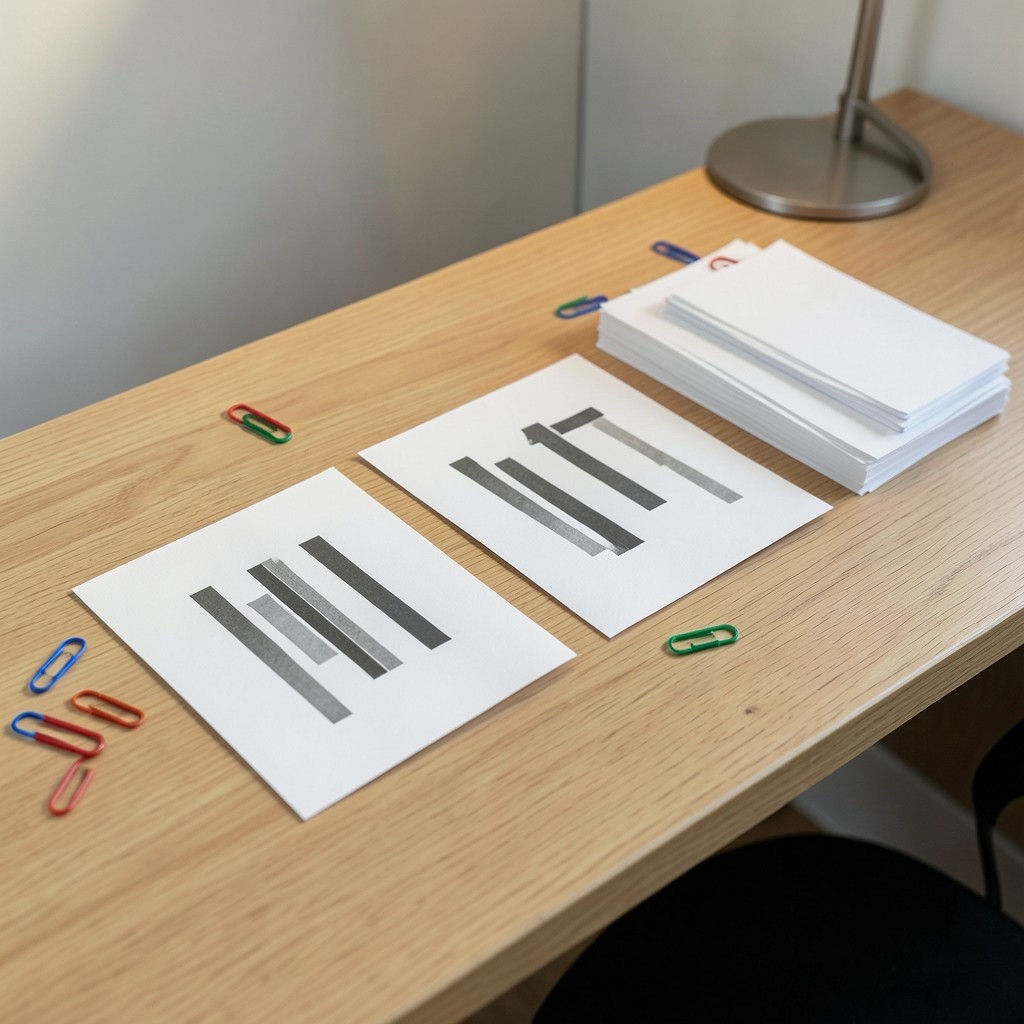
Category Spend Visualization
Turn raw spend extracts into clear category pictures—who buys what, through which channels, and how that pattern shifts across quarters.

System Latticebase
We help enterprise procurement and operations teams in Thailand see where requisitions stall, receipts lag, and invoice matches pile up—then brief leadership with a map they can act on.
Flagship engagement
A structured reading of your purchase-to-pay path—from requisition to invoice settlement—so leadership can see where approvals stall, handoffs multiply, and supplier waits accumulate.
Read the full scopeRelated work
Each offer stays close to documents, dock stamps, and buyer conversations—not abstract dashboards for their own sake.
Turn raw spend extracts into clear category pictures—who buys what, through which channels, and how that pattern shifts across quarters.

Compare promised versus actual receipt dates for a supplier set so operations can adjust buffers, dual-source decisions, and escalation rules.

A recurring rhythm that refreshes cycle metrics and flags stages or suppliers that drifted since the last review.
How we work
Every engagement begins by naming the stages your buyers and AP already use. We sample orders, interview the people who touch them, and draw a cycle map with dwell-time callouts before any leadership meeting.
See the Cycle Map method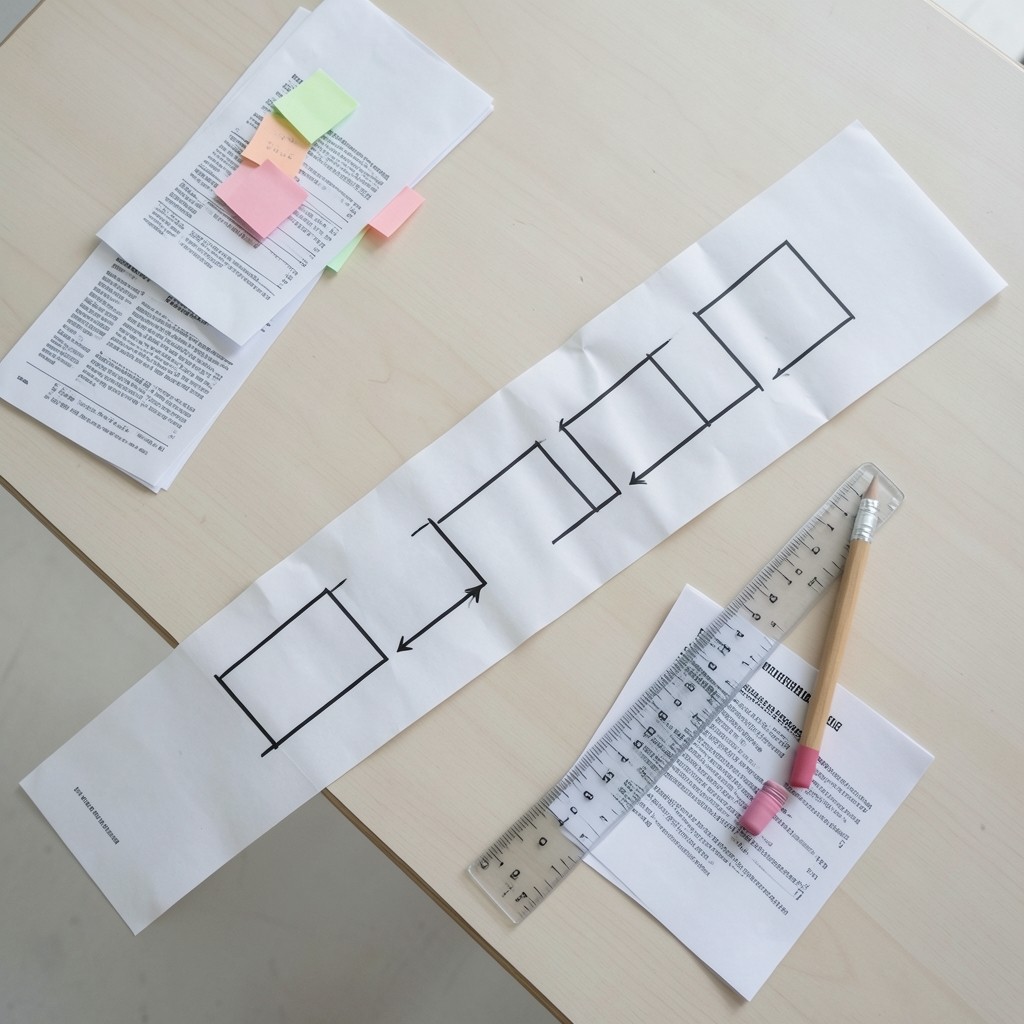
From recent work
The cycle map made our approval holds visible in a way the monthly Excel export never did. We still disagree on how aggressive the fix should be, but at least finance and buying argue from the same stage names.
Category boards for packaging survived our annual planning day without a scramble for backup tables. The concentration view was blunt about how much we leaned on one converter.